Fixed-point grids
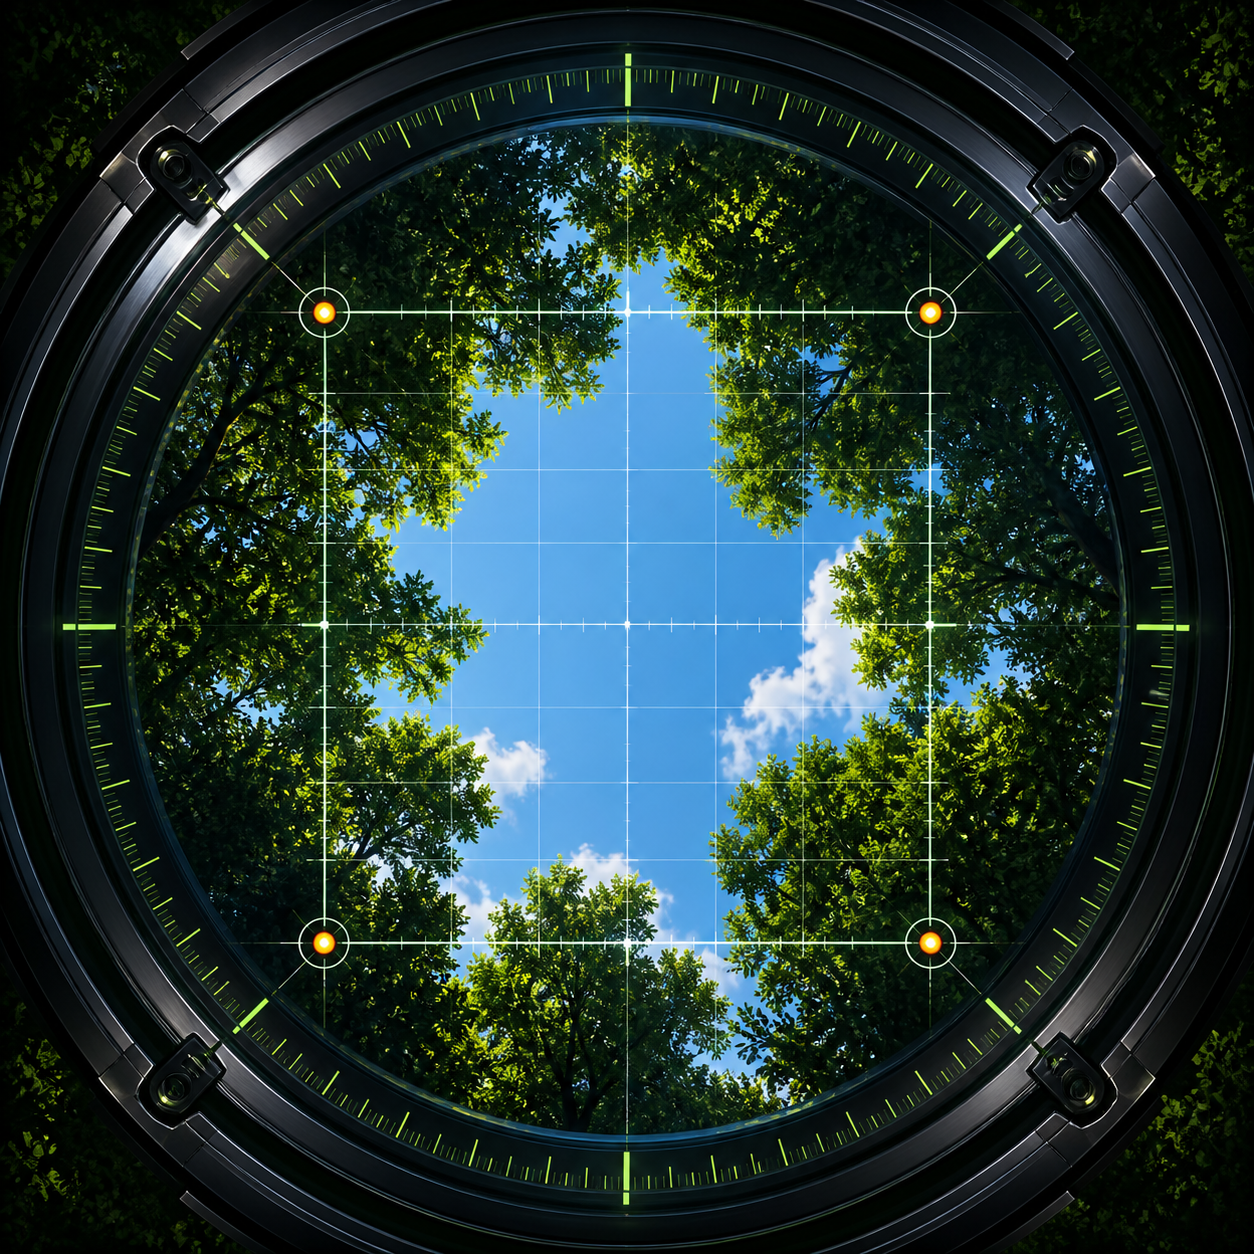
Count canopy hits at a defined sample size and review a Wilson 95% confidence interval.
Offline canopy field survey
Record repeatable canopy measurements, inspect photo classifications, preserve field context, and export review-ready reports on iPhone and iPad.
Canopyplot keeps methods separate so canopy cover, visible-sky openness, and green fractional cover are not silently treated as the same measurement. Projects and exports remain local unless you choose to share them.
Count canopy hits at a defined sample size and review a Wilson 95% confidence interval.
Preserve four directional counts and their individual replicates instead of only a final average.
Enter crown intervals along a transect and merge overlaps before calculating covered length.
Estimate projected crown area while keeping the uncorrected-overlap limitation visible.
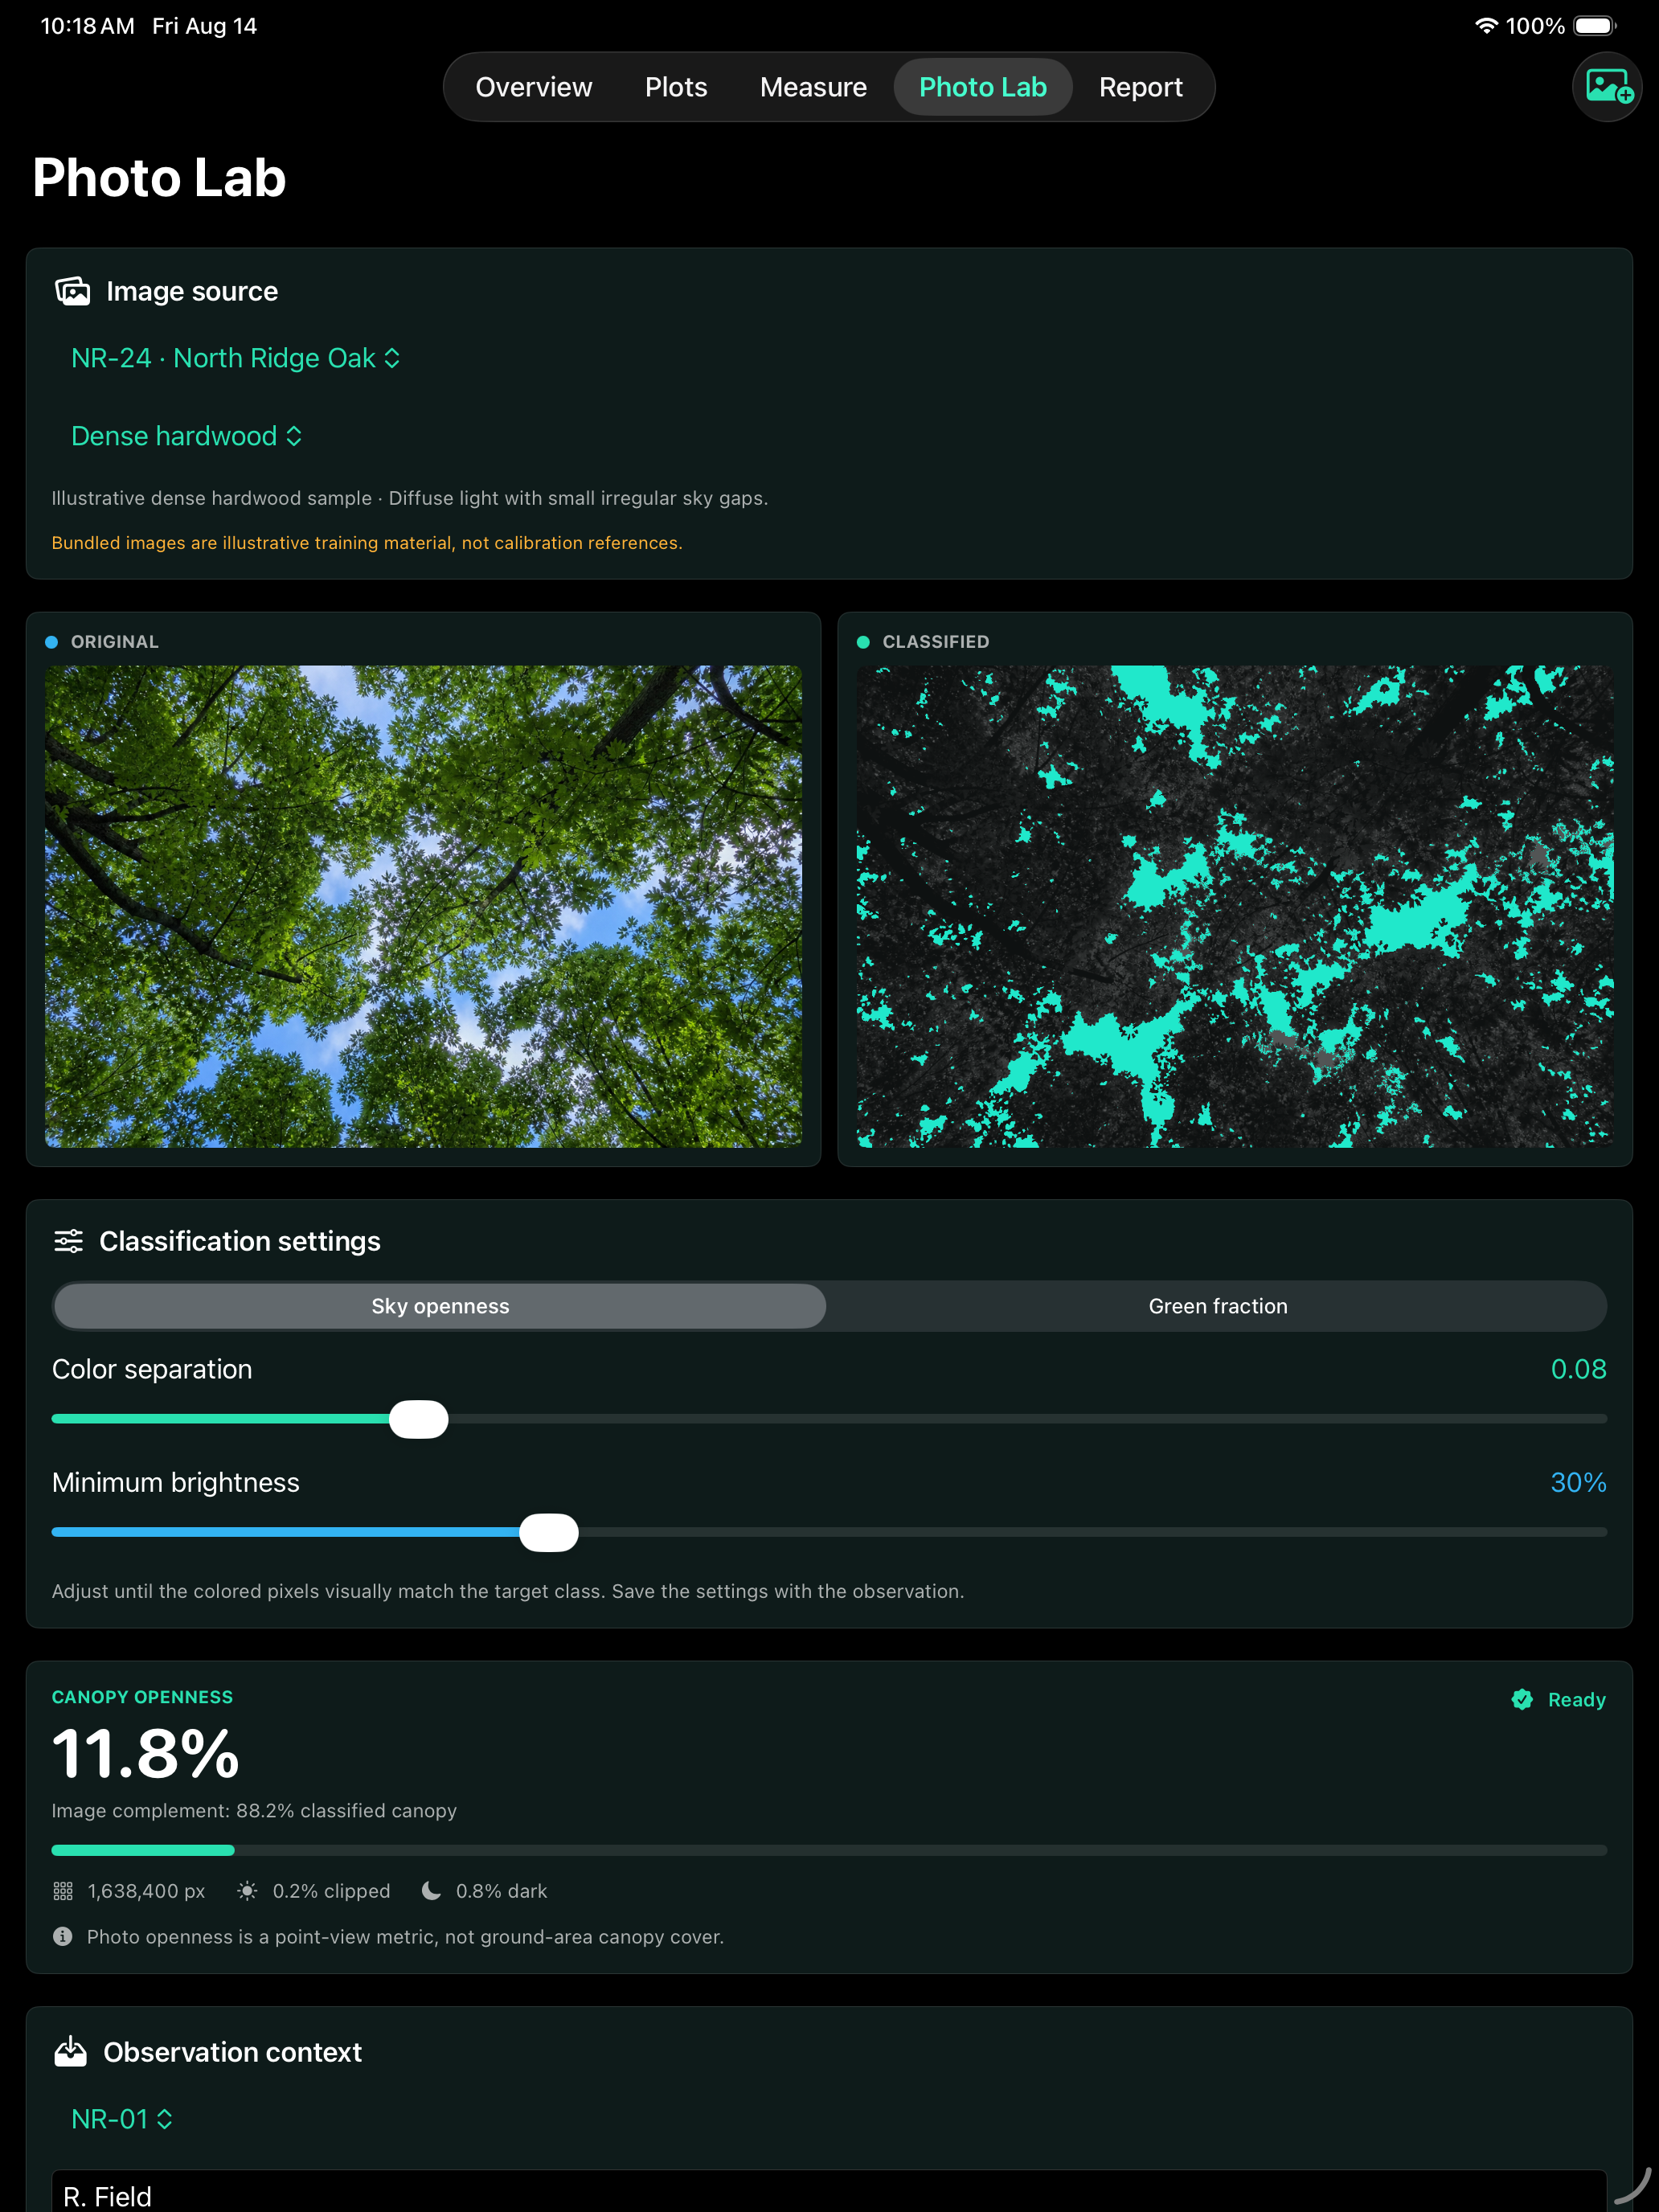
Compare the original image with the classified mask, thresholds, clipping, and deep-shadow checks.
Export PDF, CSV, and JSON packets with methods, units, station context, quality notes, and source links.
This screen was captured from build 2 on a 13-inch iPad simulator. The app keeps the original and classified image visible together so a number never replaces visual review.
Fourteen bundled field-training images demonstrate seasonal, exposure, moisture, snow, urban, crop, and rangeland edge cases. They are illustrative material, not calibration references.
Canopyplot is a field recordkeeping and calculation tool. It does not certify a survey, identify species, estimate leaf area index, replace an approved protocol, or turn one photographic viewpoint into mapped ground-area canopy cover. Select the method required by your project and document departures in the field notes.